ecdf: Create an empirical cumulative distribution function plot
A function to conveniently plot an empirical cumulative distribution function.
from mlxtend.ecdf import ecdf
Overview
A function to conveniently plot an empirical cumulative distribution function (ECDF) and adding percentile thresholds for exploratory data analysis.
References
- -
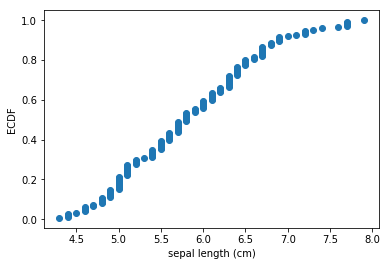
Example 1 - ECDF
from mlxtend.data import iris_data
from mlxtend.plotting import ecdf
import matplotlib.pyplot as plt

X, y = iris_data()

ax, _, _ = ecdf(x=X[:, 0], x_label='sepal length (cm)')
plt.show()
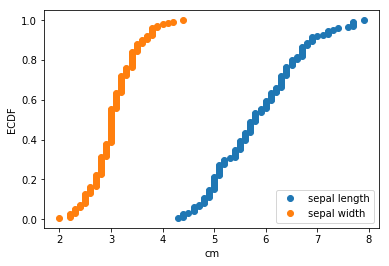
Example 2 - Multiple ECDFs
from mlxtend.data import iris_data
from mlxtend.plotting import ecdf
import matplotlib.pyplot as plt

X, y = iris_data()

# first ecdf
x1 = X[:, 0]
ax, _, _ = ecdf(x1, x_label='cm')

# second ecdf
x2 = X[:, 1]
ax, _, _ = ecdf(x2, ax=ax)

plt.legend(['sepal length', 'sepal width'])
plt.show()
Example 3 - ECDF with Percentile Thresholds
from mlxtend.data import iris_data
from mlxtend.plotting import ecdf
import matplotlib.pyplot as plt

X, y = iris_data()

ax, threshold, count = ecdf(x=X[:, 0],
                            x_label='sepal length (cm)',
                            percentile=0.8)

plt.show()

print('Feature threshold at the 80th percentile:', threshold)
print('Number of samples below the threshold:', count)
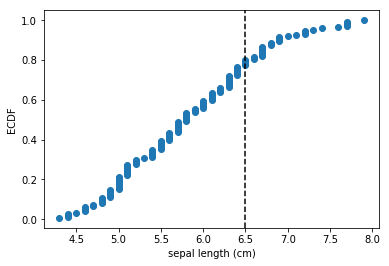
Feature threshold at the 80th percentile: 6.5
Number of samples below the threshold: 120
API
ecdf(x, y_label='ECDF', x_label=None, ax=None, percentile=None, ecdf_color=None, ecdf_marker='o', percentile_color='black', percentile_linestyle='--')
Plots an Empirical Cumulative Distribution Function
Parameters
-
x: array or list, shape=[n_samples,]Array-like object containing the feature values
-
y_label: str (default='ECDF')Text label for the y-axis
-
x_label: str (default=None)Text label for the x-axis
-
ax: matplotlib.axes.Axes (default: None)An existing matplotlib Axes. Creates one if ax=None
-
percentile: float (default=None)Float between 0 and 1 for plotting a percentile threshold line
-
ecdf_color: matplotlib color (default=None)Color for the ECDF plot; uses matplotlib defaults if None
-
ecdf_marker: matplotlib marker (default='o')Marker style for the ECDF plot
-
percentile_color: matplotlib color (default='black')Color for the percentile threshold if percentile is not None
-
percentile_linestyle: matplotlib linestyle (default='--')Line style for the percentile threshold if percentile is not None
Returns
-
ax: matplotlib.axes.Axes object -
percentile_threshold: floatFeature threshold at the percentile or None if
percentile=None -
percentile_count: Number of if percentile is not NoneNumber of samples that have a feature less or equal than the feature threshold at a percentile threshold or None if
percentile=None
Examples
For usage examples, please see https://rasbt.github.io/mlxtend/user_guide/plotting/ecdf/