mcnemar_tables: contingency tables for McNemar's test and Cochran's Q test
Function to compute a 2x2 contingency tables for McNemar's Test and Cochran's Q Test
from mlxtend.evaluate import mcnemar_tables
Overview
contingency Tables
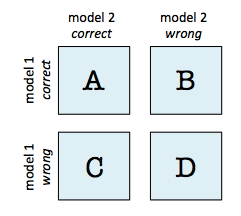
A 2x2 contingency table as being used in a McNemar's Test (mlxtend.evaluate.mcnemar) is a useful aid for comparing two different models. In contrast to a typical confusion matrix, this table compares two models to each other rather than showing the false positives, true positives, false negatives, and true negatives of a single model's predictions:
For instance, given that 2 models have a accuracy of with a 99.7% and 99.6% a 2x2 contingency table can provide further insights for model selection.
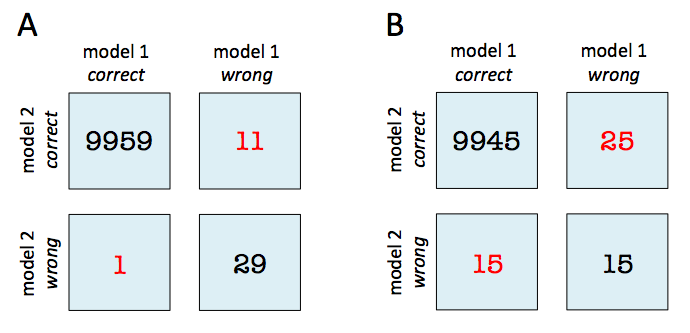
In both subfigure A and B, the predictive accuracies of the two models are as follows:
- model 1 accuracy: 9,960 / 10,000 = 99.6%
- model 2 accuracy: 9,970 / 10,000 = 99.7%
Now, in subfigure A, we can see that model 2 got 11 predictions right that model 1 got wrong. Vice versa, model 2 got 1 prediction right that model 2 got wrong. Thus, based on this 11:1 ratio, we may conclude that model 2 performs substantially better than model 1. However, in subfigure B, the ratio is 25:15, which is less conclusive about which model is the better one to choose.
References
- McNemar, Quinn, 1947. "Note on the sampling error of the difference between correlated proportions or percentages". Psychometrika. 12 (2): 153–157.
- Edwards AL: Note on the “correction for continuity” in testing the significance of the difference between correlated proportions. Psychometrika. 1948, 13 (3): 185-187. 10.1007/BF02289261.
- https://en.wikipedia.org/wiki/McNemar%27s_test
Example 1 - Single 2x2 contingency Table
import numpy as np
from mlxtend.evaluate import mcnemar_tables

y_true = np.array([0, 0, 0, 0, 0, 1, 1, 1, 1, 1])

y_mod0 = np.array([0, 1, 0, 0, 0, 1, 1, 0, 0, 0])
y_mod1 = np.array([0, 0, 1, 1, 0, 1, 1, 0, 0, 0])

tb = mcnemar_tables(y_true,
                    y_mod0,
                    y_mod1)

tb
{'model_0 vs model_1': array([[ 4.,  1.],
        [ 2.,  3.]])}
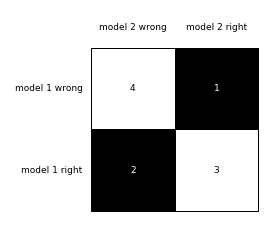
To visualize (and better interpret) the contingency table via matplotlib, we can use the checkerboard_plot function:
from mlxtend.plotting import checkerboard_plot
import matplotlib.pyplot as plt

brd = checkerboard_plot(tb['model_0 vs model_1'],
                        figsize=(3, 3),
                        fmt='%d',
                        col_labels=['model 2 wrong', 'model 2 right'],
                        row_labels=['model 1 wrong', 'model 1 right'])
plt.show()
Example 2 - Multiple 2x2 contingency Tables
If more than two models are provided as input to the mcnemar_tables function, a 2x2 contingency table will be created for each pair of models:
import numpy as np
from mlxtend.evaluate import mcnemar_tables

y_true = np.array([0, 0, 0, 0, 0, 1, 1, 1, 1, 1])

y_mod0 = np.array([0, 1, 0, 0, 0, 1, 1, 0, 0, 0])
y_mod1 = np.array([0, 0, 1, 1, 0, 1, 1, 0, 0, 0])
y_mod2 = np.array([0, 0, 1, 1, 0, 1, 1, 0, 1, 0])

tb = mcnemar_tables(y_true,
                    y_mod0,
                    y_mod1,
                    y_mod2)

for key, value in tb.items():
    print(key, '\n', value, '\n')
model_0 vs model_1
 [[ 4.  1.]
 [ 2.  3.]]

model_0 vs model_2
 [[ 4.  2.]
 [ 2.  2.]]

model_1 vs model_2
 [[ 5.  1.]
 [ 0.  4.]]
API
mcnemar_tables(y_target, y_model_predictions)*
Compute multiple 2x2 contigency tables for McNemar's test or Cochran's Q test.
Parameters
-
y_target: array-like, shape=[n_samples]True class labels as 1D NumPy array.
-
y_model_predictions: array-like, shape=[n_samples]Predicted class labels for a model.
Returns
-
tables: dictDictionary of NumPy arrays with shape=[2, 2]. Each dictionary key names the two models to be compared based on the order the models were passed as
*y_model_predictions. The number of dictionary entries is equal to the number of pairwise combinations between the m models, i.e., "m choose 2."For example the following target array (containing the true labels) and 3 models
- y_true = np.array([0, 0, 0, 0, 0, 1, 1, 1, 1, 1])
- y_mod0 = np.array([0, 1, 0, 0, 0, 1, 1, 0, 0, 0])
- y_mod1 = np.array([0, 0, 1, 1, 0, 1, 1, 0, 0, 0])
- y_mod2 = np.array([0, 1, 1, 1, 0, 1, 0, 0, 0, 0])
would result in the following dictionary:
{'model_0 vs model_1': array([[ 4., 1.], [ 2., 3.]]), 'model_0 vs model_2': array([[ 3., 0.], [ 3., 4.]]), 'model_1 vs model_2': array([[ 3., 0.], [ 2., 5.]])}
Each array is structured in the following way:
- tb[0, 0]: # of samples that both models predicted correctly
- tb[0, 1]: # of samples that model a got right and model b got wrong
- tb[1, 0]: # of samples that model b got right and model a got wrong
- tb[1, 1]: # of samples that both models predicted incorrectly
Examples
For usage examples, please see
https://rasbt.github.io/mlxtend/user_guide/evaluate/mcnemar_tables/
ython