scoring: computing various performance metrics
A function for computing various different performance metrics.
from mlxtend.evaluate import scoring
Overview
Confusion Matrix
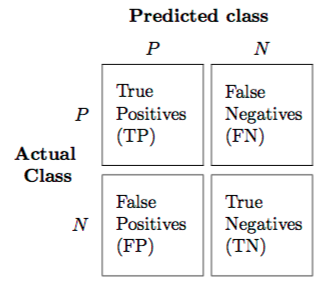
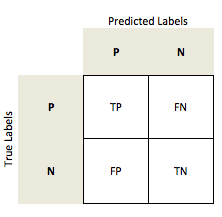
The confusion matrix (or error matrix) is one way to summarize the performance of a classifier for binary classification tasks. This square matrix consists of columns and rows that list the number of instances as absolute or relative "actual class" vs. "predicted class" ratios.
Let be the label of class 1 and be the label of a second class or the label of all classes that are not class 1 in a multi-class setting.
Error and Accuracy
Both the prediction error (ERR) and accuracy (ACC) provide general information about how many samples are misclassified. The error can be understood as the sum of all false predictions divided by the number of total predications, and the the accuracy is calculated as the sum of correct predictions divided by the total number of predictions, respectively.
True and False Positive Rates
The True Positive Rate (TPR) and False Positive Rate (FPR) are performance metrics that are especially useful for imbalanced class problems. In spam classification, for example, we are of course primarily interested in the detection and filtering out of spam. However, it is also important to decrease the number of messages that were incorrectly classified as spam (False Positives): A situation where a person misses an important message is considered as "worse" than a situation where a person ends up with a few spam messages in his e-mail inbox. In contrast to the FPR, the True Positive Rate provides useful information about the fraction of positive (or relevant) samples that were correctly identified out of the total pool of Positives.
Precision, Recall, and the F1-Score
Precision (PRE) and Recall (REC) are metrics that are more commonly used in Information Technology and related to the False and True Prositive Rates. In fact, Recall is synonymous to the True Positive Rate and also sometimes called Sensitivity. The F-Score can be understood as a combination of both Precision and Recall.
Sensitivity and Specificity
Sensitivity (SEN) is synonymous to Recall and the True Positive Rate whereas Specificity (SPC) is synonymous to the True Negative Rate -- Sensitivity measures the recovery rate of the Positives and complimentary, the Specificity measures the recovery rate of the Negatives.
Matthews Correlation Coefficient
Matthews correlation coefficient (MCC) was first formulated by Brian W. Matthews [3] in 1975 to assess the performance of protein secondary structure predictions. The MCC can be understood as a specific case of a linear correlation coefficient (Pearson's R) for a binary classification setting and is considered as especially useful in unbalanced class settings. The previous metrics take values in the range between 0 (worst) and 1 (best), whereas the MCC is bounded between the range 1 (perfect correlation between ground truth and predicted outcome) and -1 (inverse or negative correlation) -- a value of 0 denotes a random prediction.
Average Per-Class Accuracy
The "overall" accuracy is defined as the number of correct predictions (true positives TP and true negatives TN) over all samples n:
in a binary class setting:
In a multi-class setting, we can generalize the computation of the accuracy as the fraction of all true predictions (the diagonal) over all samples n.
Considering a multi-class problem with 3 classes (C0, C1, C2)
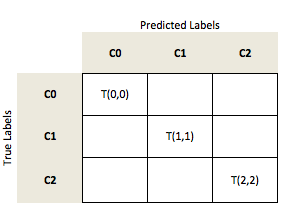
let's assume our model made the following predictions:
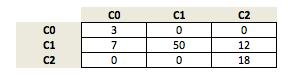
We compute the accuracy as:
Now, in order to compute the average per-class accuracy, we compute the binary accuracy for each class label separately; i.e., if class 1 is the positive class, class 0 and 2 are both considered the negative class.
References
- [1] S. Raschka. An overview of general performance metrics of binary classifier systems. Computing Research Repository (CoRR), abs/1410.5330, 2014.
- [2] Cyril Goutte and Eric Gaussier. A probabilistic interpretation of precision, recall and f-score, with implication for evaluation. In Advances in Information Retrieval, pages 345–359. Springer, 2005.
- [3] Brian W Matthews. Comparison of the predicted and observed secondary structure of T4 phage lysozyme. Biochimica et Biophysica Acta (BBA)- Protein Structure, 405(2):442–451, 1975.
Example 1 - Classification Error
from mlxtend.evaluate import scoring

y_targ = [1, 1, 1, 0, 0, 2, 0, 3]
y_pred = [1, 0, 1, 0, 0, 2, 1, 3]
res = scoring(y_target=y_targ, y_predicted=y_pred, metric='error')

print('Error: %s%%' % (res * 100))
Error: 25.0%
API
scoring(y_target, y_predicted, metric='error', positive_label=1, unique_labels='auto')
Compute a scoring metric for supervised learning.
Parameters
-
y_target: array-like, shape=[n_values]True class labels or target values.
-
y_predicted: array-like, shape=[n_values]Predicted class labels or target values.
-
metric: str (default: 'error')Performance metric: 'accuracy': (TP + TN)/(FP + FN + TP + TN) = 1-ERR
'average per-class accuracy': Average per-class accuracy
'average per-class error': Average per-class error
'error': (TP + TN)/(FP+ FN + TP + TN) = 1-ACC
'false_positive_rate': FP/N = FP/(FP + TN)
'true_positive_rate': TP/P = TP/(FN + TP)
'true_negative_rate': TN/N = TN/(FP + TN)
'precision': TP/(TP + FP)
'recall': equal to 'true_positive_rate'
'sensitivity': equal to 'true_positive_rate' or 'recall'
'specificity': equal to 'true_negative_rate'
'f1': 2 * (PRE * REC)/(PRE + REC)
'matthews_corr_coef': (TPTN - FPFN) / (sqrt{(TP + FP)( TP + FN )( TN + FP )( TN + FN )})
Where: [TP: True positives, TN = True negatives,
TN: True negatives, FN = False negatives]
-
positive_label: int (default: 1)Label of the positive class for binary classification metrics.
-
unique_labels: str or array-like (default: 'auto')If 'auto', deduces the unique class labels from y_target
Returns
score: float
Examples
For usage examples, please see https://rasbt.github.io/mlxtend/user_guide/evaluate/scoring/