stacked_barplot: Plot stacked bar plots in matplotlib
A function to conveniently plot stacked bar plots in matplotlib using pandas DataFrames.
from mlxtend.plotting import stacked_barplot
Overview
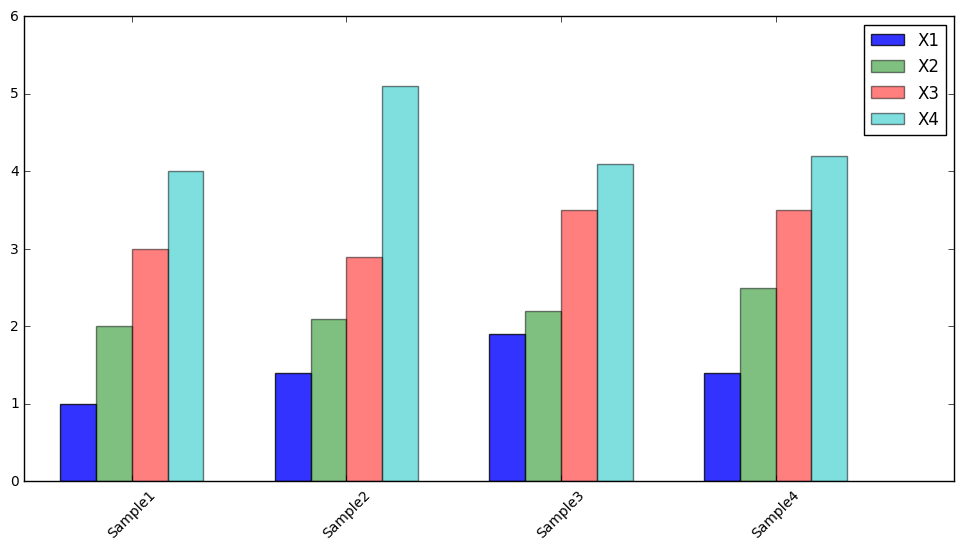
A matplotlib convenience function for creating barplots from DataFrames where each sample is associated with several categories.
References
- -
Example 1 - Stacked Barplot from Pandas DataFrames
import pandas as pd

s1 = [1.0, 2.0, 3.0, 4.0]
s2 = [1.4, 2.1, 2.9, 5.1]
s3 = [1.9, 2.2, 3.5, 4.1]
s4 = [1.4, 2.5, 3.5, 4.2]
data = [s1, s2, s3, s4]

df = pd.DataFrame(data, columns=['X1', 'X2', 'X3', 'X4'])
df.columns = ['X1', 'X2', 'X3', 'X4']
df.index = ['Sample1', 'Sample2', 'Sample3', 'Sample4']
df
| X1 | X2 | X3 | X4 | |
|---|---|---|---|---|
| Sample1 | 1.0 | 2.0 | 3.0 | 4.0 |
| Sample2 | 1.4 | 2.1 | 2.9 | 5.1 |
| Sample3 | 1.9 | 2.2 | 3.5 | 4.1 |
| Sample4 | 1.4 | 2.5 | 3.5 | 4.2 |
By default, the index of the DataFrame is used as column labels, and the DataFrame columns are used for the plot legend.
import matplotlib.pyplot as plt
from mlxtend.plotting import stacked_barplot

fig = stacked_barplot(df, rotation=45, legend_loc='best')

API
stacked_barplot(df, bar_width='auto', colors='bgrcky', labels='index', rotation=90, legend_loc='best')
Function to plot stacked barplots
Parameters
-
df: pandas.DataFrameA pandas DataFrame where the index denotes the x-axis labels, and the columns contain the different measurements for each row. bar_width: 'auto' or float (default: 'auto') Parameter to set the widths of the bars. if 'auto', the width is automatically determined by the number of columns in the dataset. colors: str (default: 'bgrcky') The colors of the bars. labels: 'index' or iterable (default: 'index') If 'index', the DataFrame index will be used as x-tick labels. rotation: int (default: 90) Parameter to rotate the x-axis labels.
-
legend_loc: str (default: 'best')Location of the plot legend {best, upper left, upper right, lower left, lower right} No legend if legend_loc=False
Returns
fig: matplotlib.pyplot figure object
Examples
For usage examples, please see https://rasbt.github.io/mlxtend/user_guide/plotting/stacked_barplot/