checkerboard_plot: Create a checkerboard plot in matplotlib
Function to plot a checkerboard plot / heat map via matplotlib
from mlxtend.plotting import checkerboard_plot
Overview
Function to plot a checkerboard plot / heat map via matplotlib.
References
- -
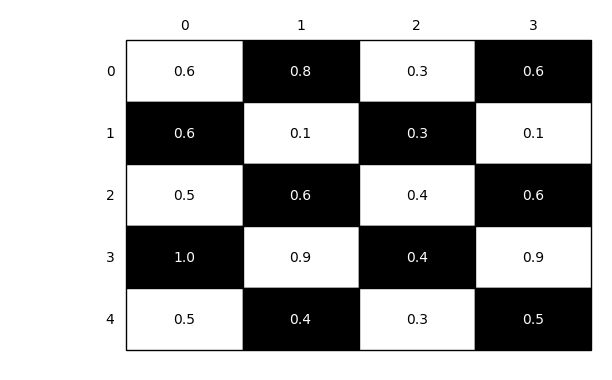
Example 1 - Default
from mlxtend.plotting import checkerboard_plot
import matplotlib.pyplot as plt
import numpy as np

ary = np.random.random((5, 4))

brd = checkerboard_plot(ary)
plt.show()
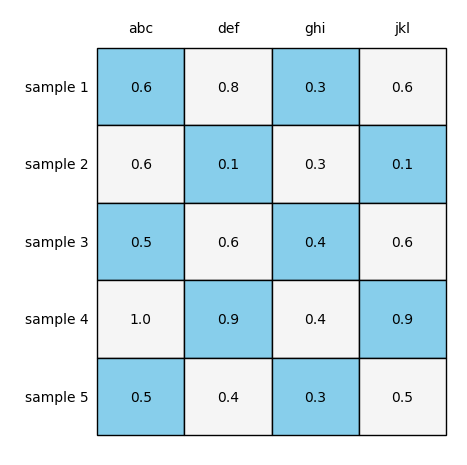
Example 2 - Changing colors and labels
from mlxtend.plotting import checkerboard_plot
import matplotlib.pyplot as plt
import numpy as np

checkerboard_plot(ary,
                  col_labels=['abc', 'def', 'ghi', 'jkl'],
                  row_labels=['sample %d' % i for i in range(1, 6)],
                  cell_colors=['skyblue', 'whitesmoke'],
                  font_colors=['black', 'black'],
                  figsize=(4.5, 5))
plt.show()
API
checkerboard_plot(ary, cell_colors=('white', 'black'), font_colors=('black', 'white'), fmt='%.1f', figsize=None, row_labels=None, col_labels=None, fontsize=None)
Plot a checkerboard table / heatmap via matplotlib.
Parameters
-
ary: array-like, shape = [n, m]A 2D Nnumpy array.
-
cell_colors: tuple or list (default: ('white', 'black'))Tuple or list containing the two colors of the checkerboard pattern.
-
font_colors: tuple or list (default: ('black', 'white'))Font colors corresponding to the cell colors.
-
figsize: tuple (default: (2.5, 2.5))Height and width of the figure
-
fmt: str (default: '%.1f')Python string formatter for cell values. The default '%.1f' results in floats with 1 digit after the decimal point. Use '%d' to show numbers as integers.
-
row_labels: list (default: None)List of the row labels. Uses the array row indices 0 to n by default.
-
col_labels: list (default: None)List of the column labels. Uses the array column indices 0 to m by default.
-
fontsize: int (default: None)Specifies the font size of the checkerboard table. Uses matplotlib's default if None.
Returns
fig: matplotlib Figure object.
Examples
For usage examples, please see https://rasbt.github.io/mlxtend/user_guide/plotting/checkerboard_plot/