plot_sequential_feature_selection: Visualize selected feature subset performances from the SequentialFeatureSelector
A matplotlib utility function for visualizing results from feature_selection.SequentialFeatureSelector.
from mlxtend.plotting import plot_sequential_feature_selection
Overview
for more information on sequential feature selection, please see feature_selection.SequentialFeatureSelector.
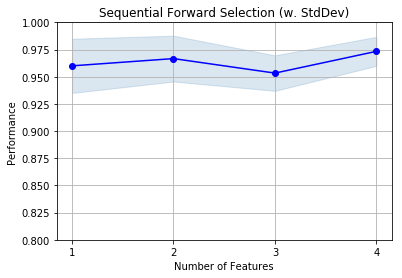
Example 1 - Plotting the results from SequentialFeatureSelector
from mlxtend.plotting import plot_sequential_feature_selection as plot_sfs
from mlxtend.feature_selection import SequentialFeatureSelector as SFS
import matplotlib.pyplot as plt
from sklearn.neighbors import KNeighborsClassifier
from sklearn.datasets import load_iris

iris = load_iris()
X = iris.data
y = iris.target
knn = KNeighborsClassifier(n_neighbors=4)

sfs = SFS(knn,
          k_features=4,
          forward=True,
          floating=False,
          scoring='accuracy',
          cv=5)

sfs = sfs.fit(X, y)

fig1 = plot_sfs(sfs.get_metric_dict(),
                kind='std_dev',
                figsize=(6, 4))

plt.ylim([0.8, 1])
plt.title('Sequential Forward Selection (w. StdDev)')
plt.grid()
plt.show()
API
plot_sequential_feature_selection(metric_dict, figsize=None, kind='std_dev', color='blue', bcolor='steelblue', marker='o', alpha=0.2, ylabel='Performance', confidence_interval=0.95)
Plot feature selection results.
Parameters
-
metric_dict: mlxtend.SequentialFeatureSelector.get_metric_dict() object -
figsize: tuple (default: None)Height and width of the figure
-
kind: str (default: "std_dev")The kind of error bar or confidence interval in {'std_dev', 'std_err', 'ci', None}.
-
color: str (default: "blue")Color of the lineplot (accepts any matplotlib color name)
-
bcolor: str (default: "steelblue").Color of the error bars / confidence intervals (accepts any matplotlib color name).
-
marker: str (default: "o")Marker of the line plot (accepts any matplotlib marker name).
-
alpha: float in [0, 1] (default: 0.2)Transparency of the error bars / confidence intervals.
-
ylabel: str (default: "Performance")Y-axis label.
-
confidence_interval: float (default: 0.95)Confidence level if
kind='ci'.
Returns
fig: matplotlib.pyplot.figure() object
Examples
For usage examples, please see https://rasbt.github.io/mlxtend/user_guide/plotting/plot_sequential_feature_selection/
ython