mnist_data: A subset of the MNIST dataset for classification
A function that loads the MNIST dataset into NumPy arrays.
from mlxtend.data import mnist_data
Overview
The MNIST dataset was constructed from two datasets of the US National Institute of Standards and Technology (NIST). The training set consists of handwritten digits from 250 different people, 50 percent high school students, and 50 percent employees from the Census Bureau. Note that the test set contains handwritten digits from different people following the same split.
Features
Each feature vector (row in the feature matrix) consists of 784 pixels (intensities) -- unrolled from the original 28x28 pixels images.
-
Number of samples: A subset of 5000 images (the first 500 digits of each class)
-
Target variable (discrete): {500x 0, ..., 500x 9}
References
- Source: https://yann.lecun.com/exdb/mnist/
- Y. LeCun and C. Cortes. Mnist handwritten digit database. AT&T Labs [Online]. Available: https://yann.lecun.com/exdb/mnist, 2010.
Example 1 - Dataset overview
from mlxtend.data import mnist_data
X, y = mnist_data()

print('Dimensions: %s x %s' % (X.shape[0], X.shape[1]))
print('1st row', X[0])
Dimensions: 5000 x 784
1st row [   0.    0.    0.    0.    0.    0.    0.    0.    0.    0.    0.    0.
    0.    0.    0.    0.    0.    0.    0.    0.    0.    0.    0.    0.
    0.    0.    0.    0.    0.    0.    0.    0.    0.    0.    0.    0.
    0.    0.    0.    0.    0.    0.    0.    0.    0.    0.    0.    0.
    0.    0.    0.    0.    0.    0.    0.    0.    0.    0.    0.    0.
    0.    0.    0.    0.    0.    0.    0.    0.    0.    0.    0.    0.
    0.    0.    0.    0.    0.    0.    0.    0.    0.    0.    0.    0.
    0.    0.    0.    0.    0.    0.    0.    0.    0.    0.    0.    0.
    0.    0.    0.    0.    0.    0.    0.    0.    0.    0.    0.    0.
    0.    0.    0.    0.    0.    0.    0.    0.    0.    0.    0.    0.
    0.    0.    0.    0.    0.    0.    0.   51.  159.  253.  159.   50.
    0.    0.    0.    0.    0.    0.    0.    0.    0.    0.    0.    0.
    0.    0.    0.    0.    0.    0.    0.    0.    0.    0.   48.  238.
  252.  252.  252.  237.    0.    0.    0.    0.    0.    0.    0.    0.
    0.    0.    0.    0.    0.    0.    0.    0.    0.    0.    0.    0.
    0.   54.  227.  253.  252.  239.  233.  252.   57.    6.    0.    0.
    0.    0.    0.    0.    0.    0.    0.    0.    0.    0.    0.    0.
    0.    0.    0.   10.   60.  224.  252.  253.  252.  202.   84.  252.
  253.  122.    0.    0.    0.    0.    0.    0.    0.    0.    0.    0.
    0.    0.    0.    0.    0.    0.    0.  163.  252.  252.  252.  253.
  252.  252.   96.  189.  253.  167.    0.    0.    0.    0.    0.    0.
    0.    0.    0.    0.    0.    0.    0.    0.    0.    0.   51.  238.
  253.  253.  190.  114.  253.  228.   47.   79.  255.  168.    0.    0.
    0.    0.    0.    0.    0.    0.    0.    0.    0.    0.    0.    0.
    0.   48.  238.  252.  252.  179.   12.   75.  121.   21.    0.    0.
  253.  243.   50.    0.    0.    0.    0.    0.    0.    0.    0.    0.
    0.    0.    0.    0.   38.  165.  253.  233.  208.   84.    0.    0.
    0.    0.    0.    0.  253.  252.  165.    0.    0.    0.    0.    0.
    0.    0.    0.    0.    0.    0.    0.    7.  178.  252.  240.   71.
   19.   28.    0.    0.    0.    0.    0.    0.  253.  252.  195.    0.
    0.    0.    0.    0.    0.    0.    0.    0.    0.    0.    0.   57.
  252.  252.   63.    0.    0.    0.    0.    0.    0.    0.    0.    0.
  253.  252.  195.    0.    0.    0.    0.    0.    0.    0.    0.    0.
    0.    0.    0.  198.  253.  190.    0.    0.    0.    0.    0.    0.
    0.    0.    0.    0.  255.  253.  196.    0.    0.    0.    0.    0.
    0.    0.    0.    0.    0.    0.   76.  246.  252.  112.    0.    0.
    0.    0.    0.    0.    0.    0.    0.    0.  253.  252.  148.    0.
    0.    0.    0.    0.    0.    0.    0.    0.    0.    0.   85.  252.
  230.   25.    0.    0.    0.    0.    0.    0.    0.    0.    7.  135.
  253.  186.   12.    0.    0.    0.    0.    0.    0.    0.    0.    0.
    0.    0.   85.  252.  223.    0.    0.    0.    0.    0.    0.    0.
    0.    7.  131.  252.  225.   71.    0.    0.    0.    0.    0.    0.
    0.    0.    0.    0.    0.    0.   85.  252.  145.    0.    0.    0.
    0.    0.    0.    0.   48.  165.  252.  173.    0.    0.    0.    0.
    0.    0.    0.    0.    0.    0.    0.    0.    0.    0.   86.  253.
  225.    0.    0.    0.    0.    0.    0.  114.  238.  253.  162.    0.
    0.    0.    0.    0.    0.    0.    0.    0.    0.    0.    0.    0.
    0.    0.   85.  252.  249.  146.   48.   29.   85.  178.  225.  253.
  223.  167.   56.    0.    0.    0.    0.    0.    0.    0.    0.    0.
    0.    0.    0.    0.    0.    0.   85.  252.  252.  252.  229.  215.
  252.  252.  252.  196.  130.    0.    0.    0.    0.    0.    0.    0.
    0.    0.    0.    0.    0.    0.    0.    0.    0.    0.   28.  199.
  252.  252.  253.  252.  252.  233.  145.    0.    0.    0.    0.    0.
    0.    0.    0.    0.    0.    0.    0.    0.    0.    0.    0.    0.
    0.    0.    0.   25.  128.  252.  253.  252.  141.   37.    0.    0.
    0.    0.    0.    0.    0.    0.    0.    0.    0.    0.    0.    0.
    0.    0.    0.    0.    0.    0.    0.    0.    0.    0.    0.    0.
    0.    0.    0.    0.    0.    0.    0.    0.    0.    0.    0.    0.
    0.    0.    0.    0.    0.    0.    0.    0.    0.    0.    0.    0.
    0.    0.    0.    0.    0.    0.    0.    0.    0.    0.    0.    0.
    0.    0.    0.    0.    0.    0.    0.    0.    0.    0.    0.    0.
    0.    0.    0.    0.    0.    0.    0.    0.    0.    0.    0.    0.
    0.    0.    0.    0.    0.    0.    0.    0.    0.    0.    0.    0.
    0.    0.    0.    0.    0.    0.    0.    0.    0.    0.    0.    0.
    0.    0.    0.    0.    0.    0.    0.    0.    0.    0.    0.    0.
    0.    0.    0.    0.]
import numpy as np
print('Classes: Setosa, Versicolor, Virginica')
print(np.unique(y))
print('Class distribution: %s' % np.bincount(y))
Classes: Setosa, Versicolor, Virginica
[0 1 2 3 4 5 6 7 8 9]
Class distribution: [500 500 500 500 500 500 500 500 500 500]
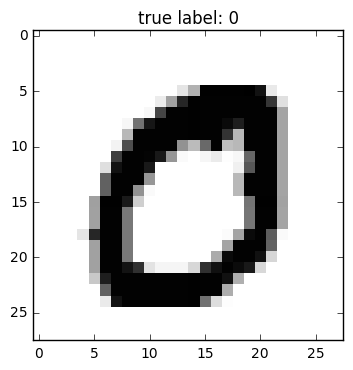
Example 2 - Visualize MNIST
%matplotlib inline
import matplotlib.pyplot as plt
def plot_digit(X, y, idx):
    img = X[idx].reshape(28,28)
    plt.imshow(img, cmap='Greys',  interpolation='nearest')
    plt.title('true label: %d' % y[idx])
    plt.show()
plot_digit(X, y, 4)
API
mnist_data()
5000 samples from the MNIST handwritten digits dataset.
Data Source: https://yann.lecun.com/exdb/mnist/
Returns
-
X, y: [n_samples, n_features], [n_class_labels]X is the feature matrix with 5000 image samples as rows, each row consists of 28x28 pixels that were unrolled into 784 pixel feature vectors. y contains the 10 unique class labels 0-9.
Examples
For usage examples, please see https://rasbt.github.io/mlxtend/user_guide/data/mnist_data/